
NASA’s Chandra Releases Deep Cut From Catalog of Cosmic Recordings
- NASA’s Chandra X-ray Observatory has released an updated version of its cosmic recording catalog, known as the Chandra Source Catalog (CSC) 2.1, which contains over 400,000 unique sources and 1.3 million individual detections.
- The CSC is a treasure trove of information gathered from Chandra’s observations, including precise positions on the sky and X-ray energies detected, allowing scientists to combine this data with other types of light from telescopes like James Webb and Hubble Space Telescopes.
- A new sonification of the CSC has been released, translating astronomical data into sound, which represents 22 years of Chandra observations across the sky, including repeat X-ray sightings over time through different notes.
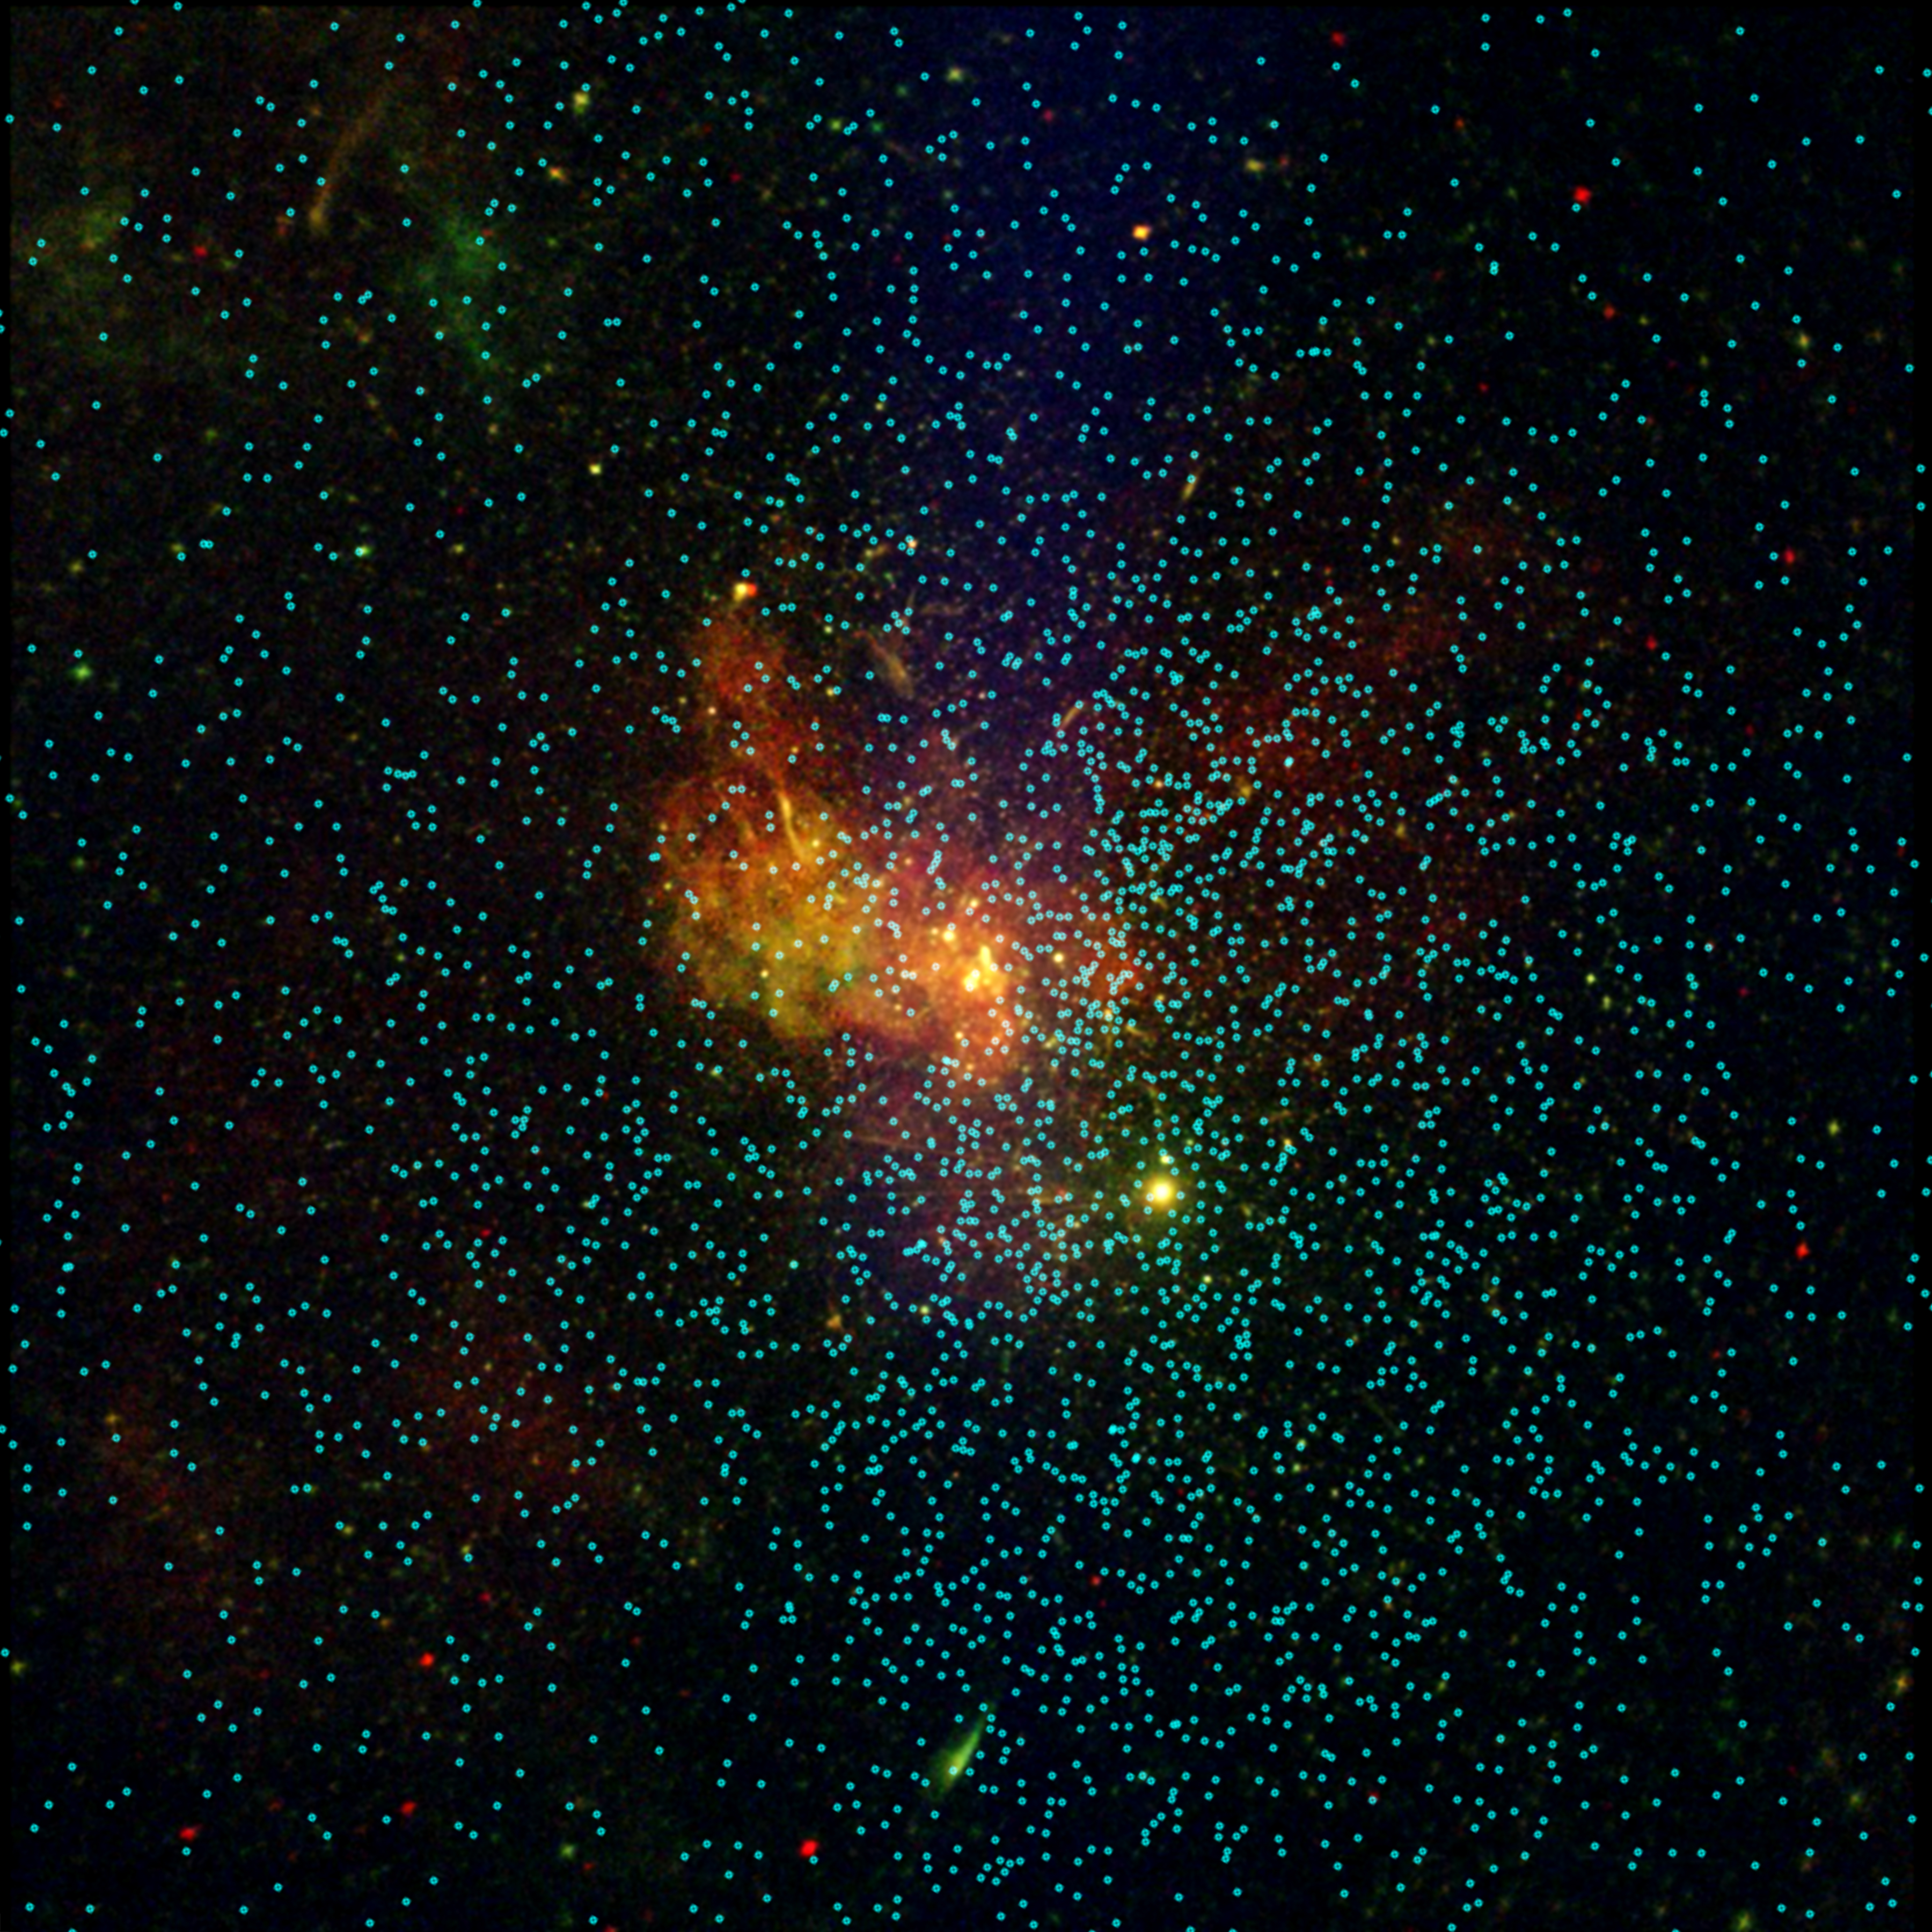
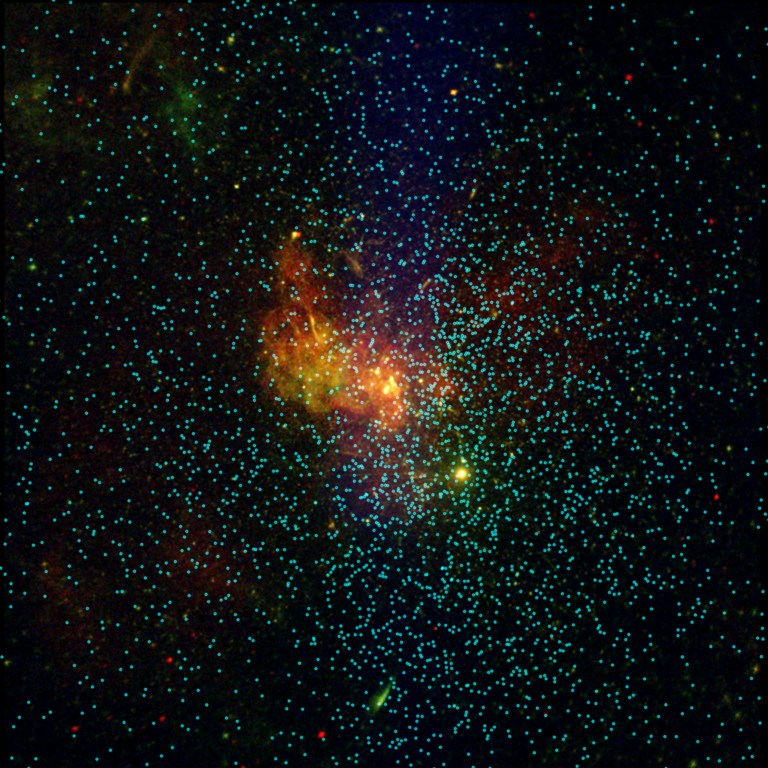
- The updated catalog includes a wealth of information about the Galactic Center, including an image of Sagittarius A*, the supermassive black hole at the center of the Milky Way galaxy, which shows over 3,300 individual sources that emit X-rays.
NASA’s Chandra Releases Deep Cut From Catalog of Cosmic Recordings
Like a recording artist who has had a long career, NASA’s Chandra X-ray Observatory has a “back catalog” of cosmic recordings that is impossible to replicate. To access these X-ray tracks, or observations, the ultimate compendium has been developed: the Chandra Source Catalog (CSC).
The CSC contains the X-ray data detected up to the end of 2020 by Chandra, the world’s premier X-ray telescope and one of NASA’s “Great Observatories.” The latest version of the CSC, known as CSC 2.1, contains over 400,000 unique compact and extended sources and over 1.3 million individual detections in X-ray light.

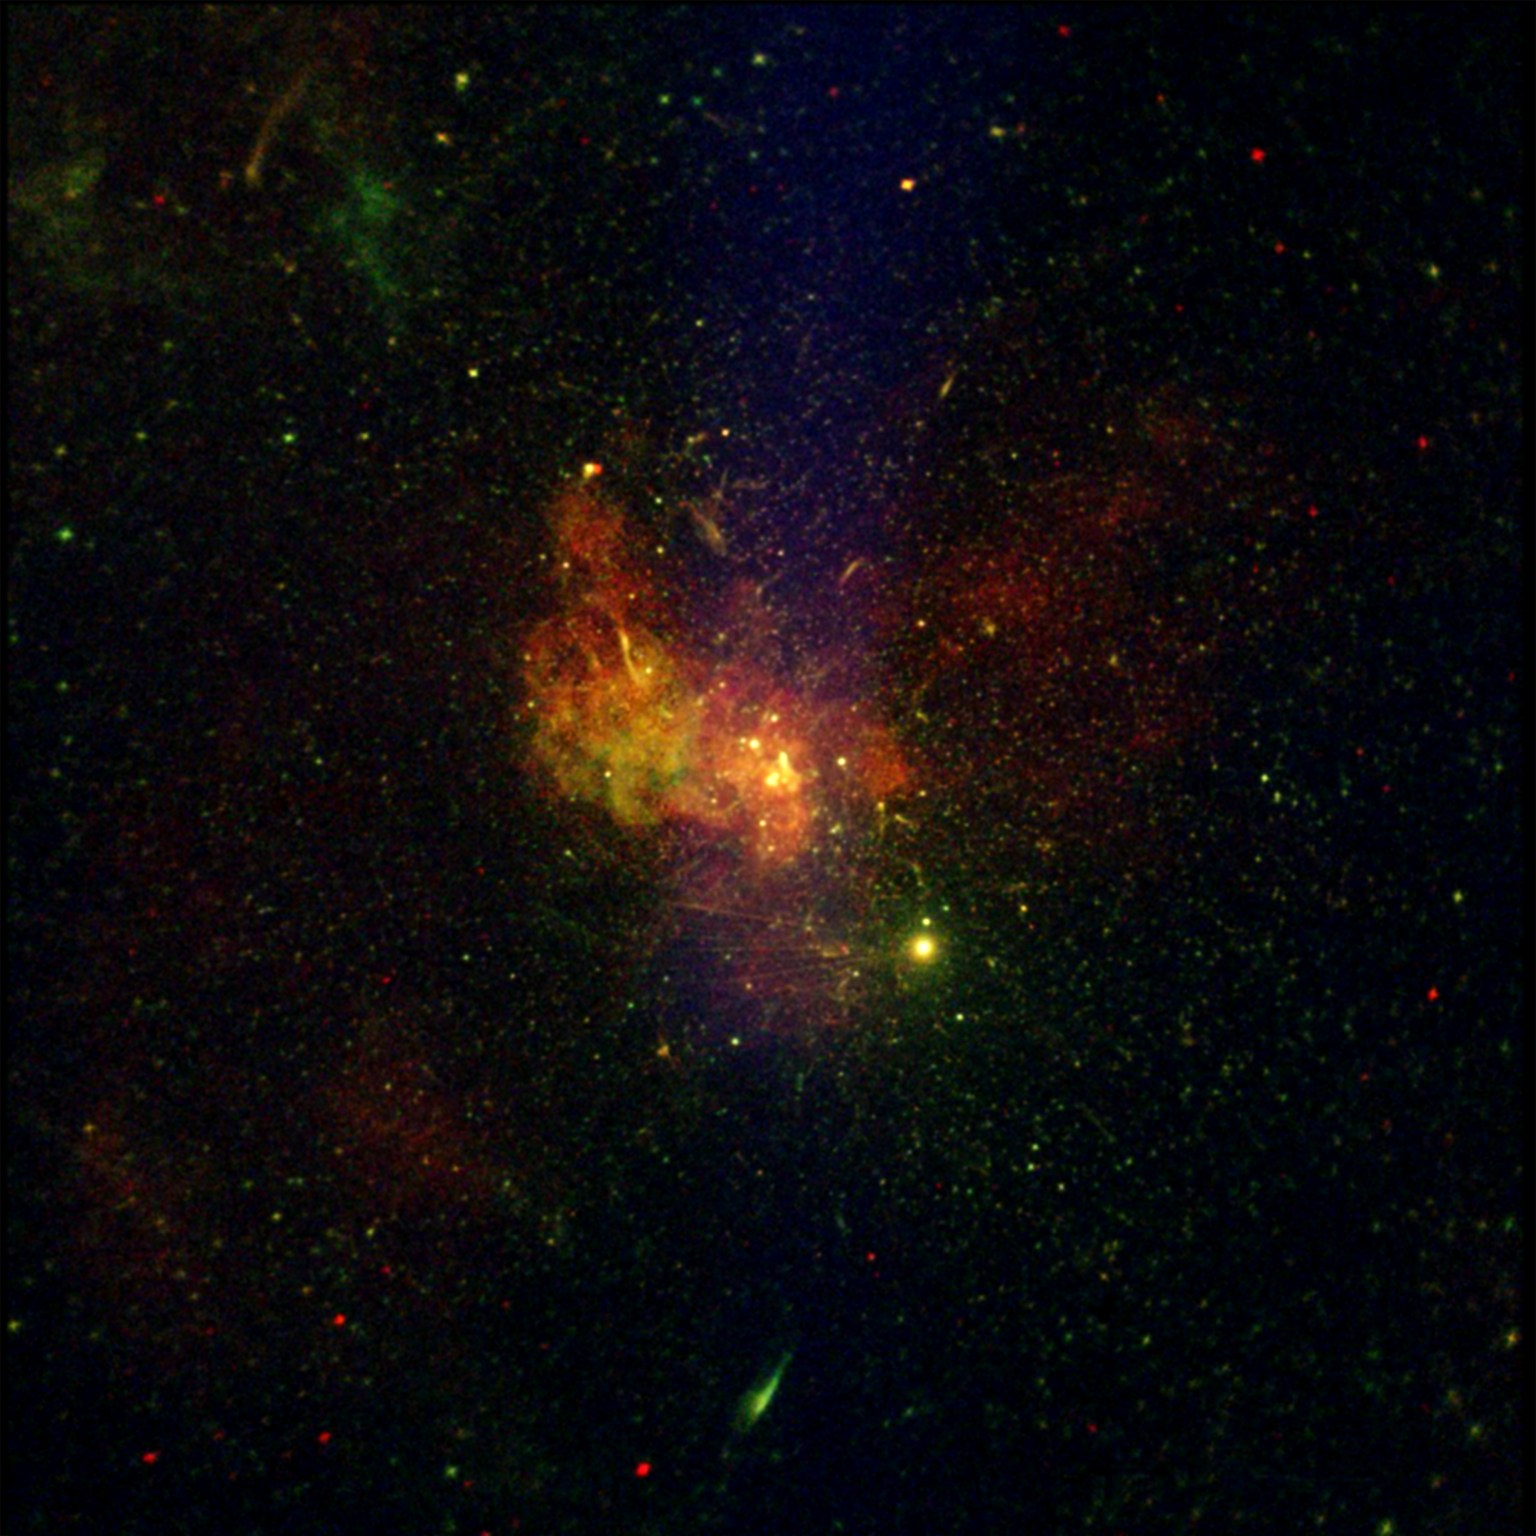
before
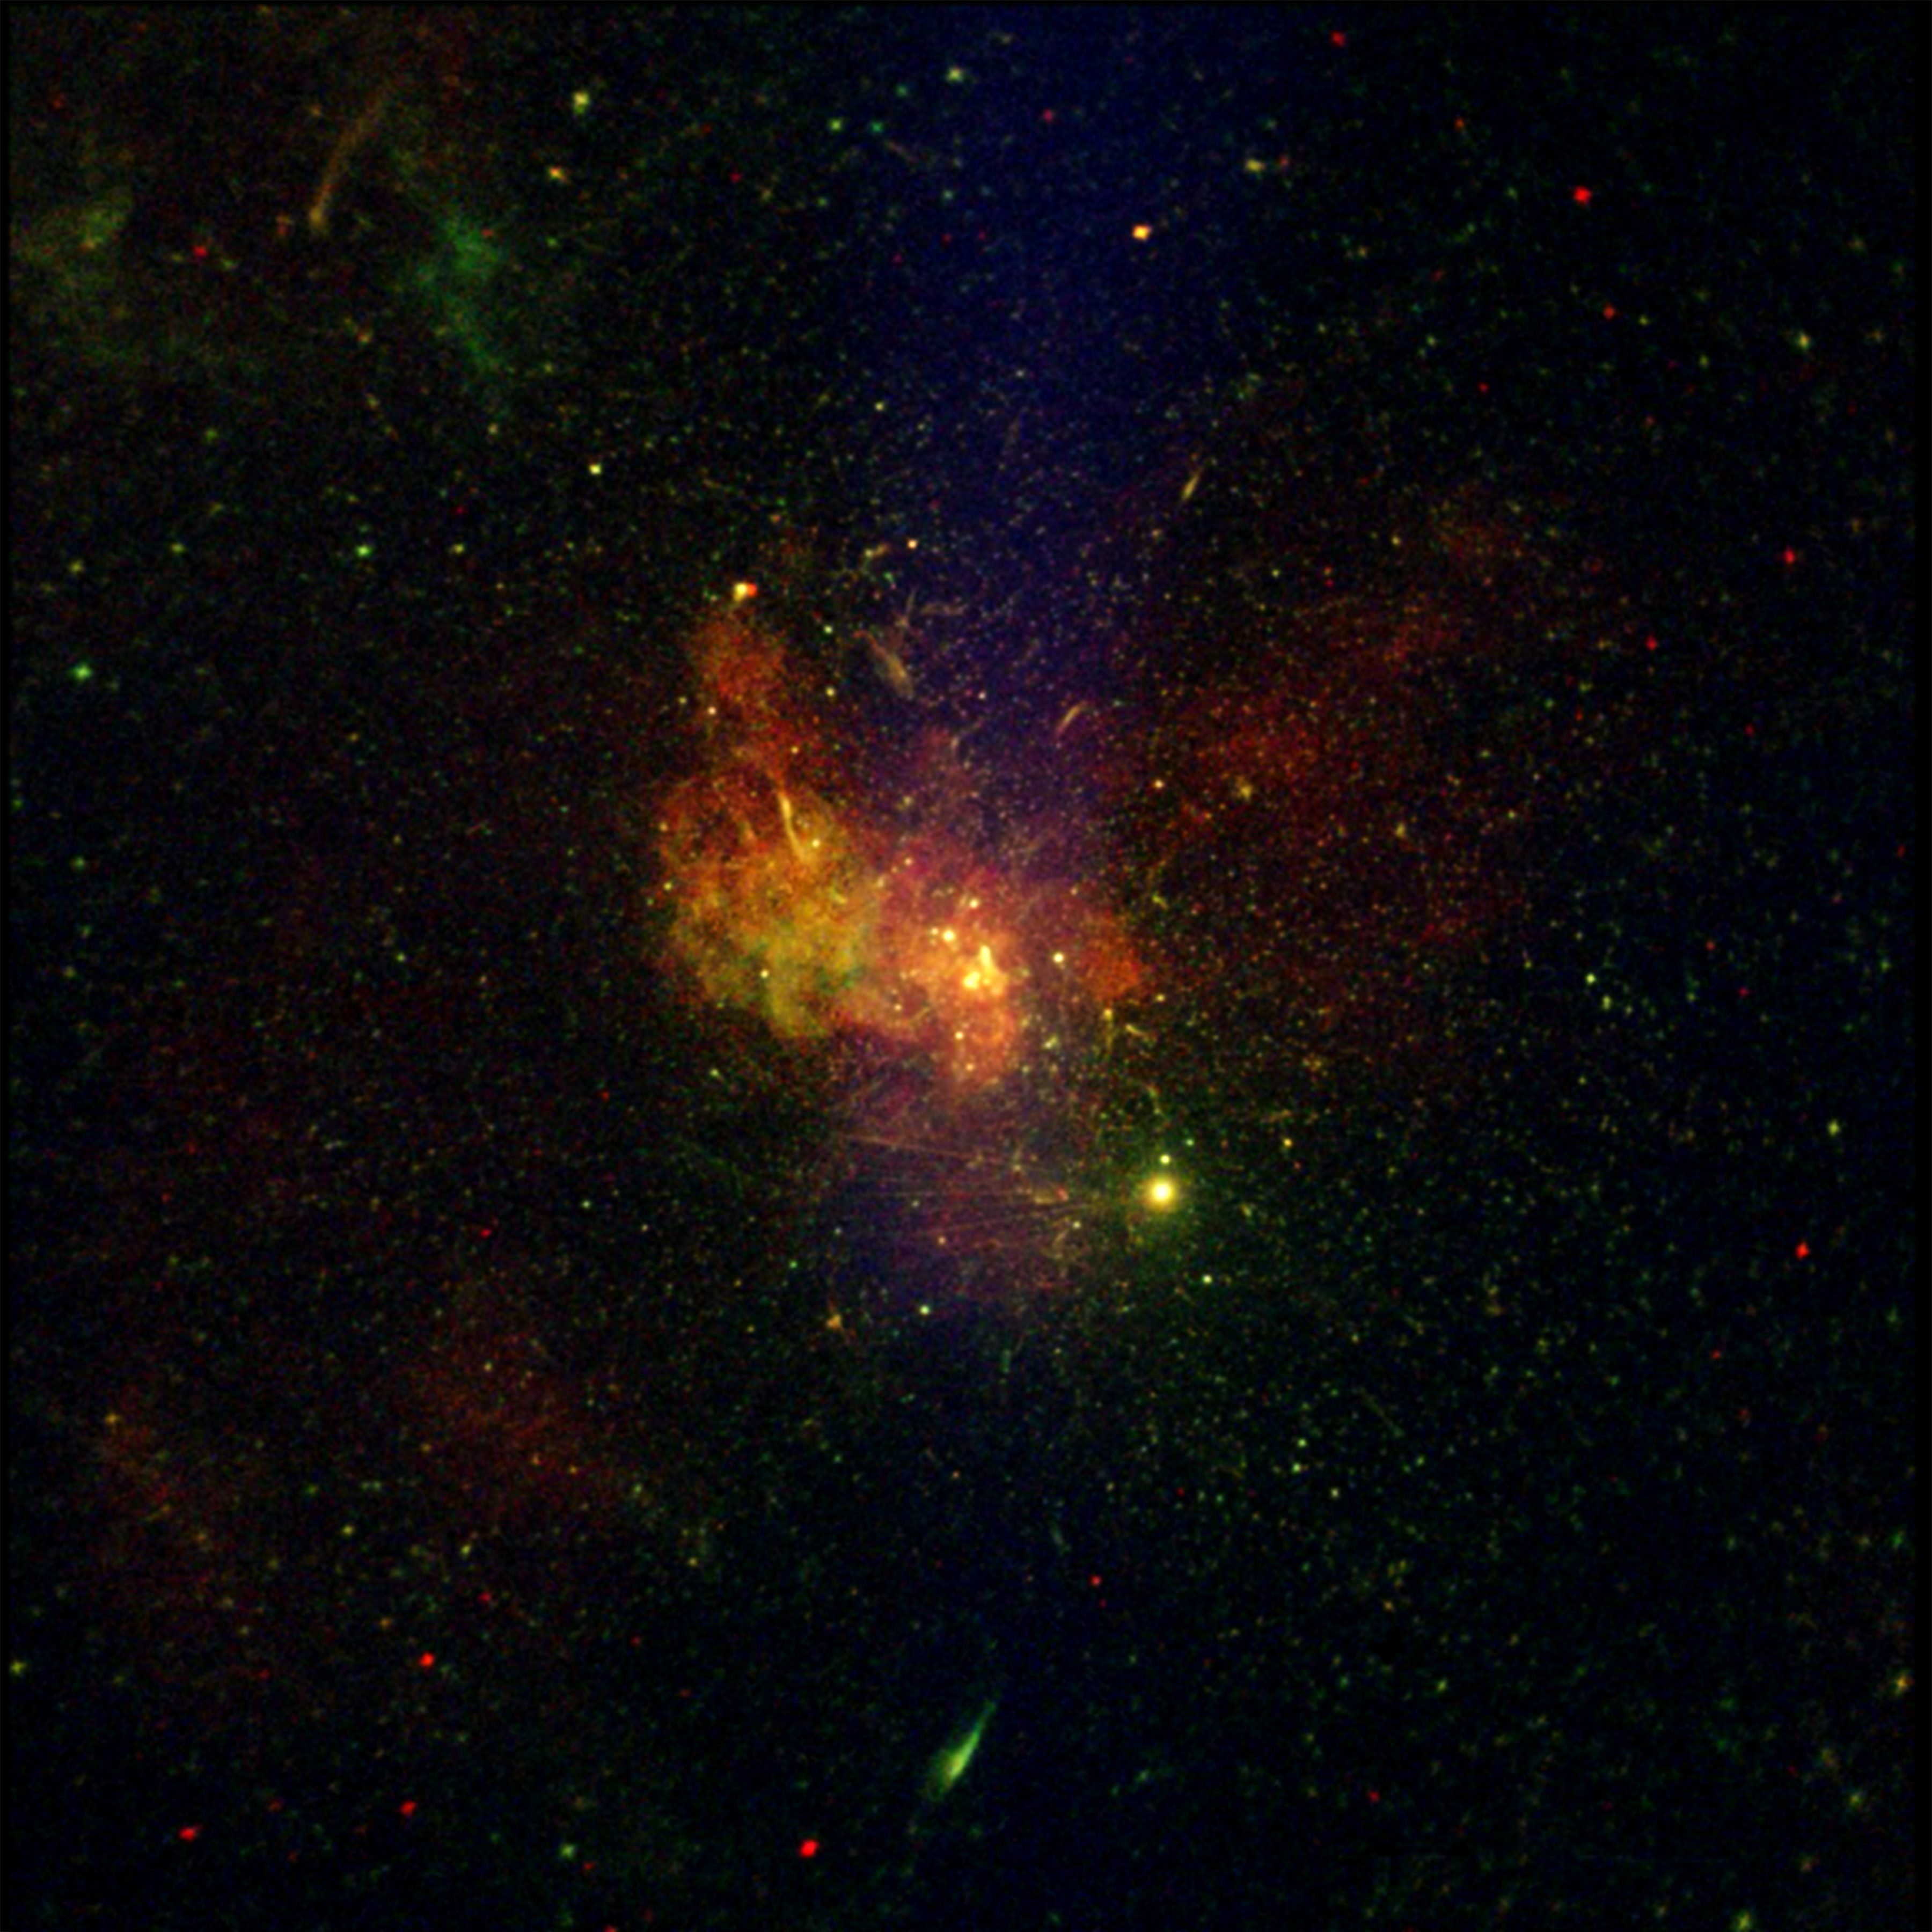
after
Before and After
X-ray Images of Sagittarius A*
1999 – 2021
Within the CSC, there is a wealth of information gleaned from the Chandra observations — from precise positions on the sky to information about the the X-ray energies detected. This allows scientists using other telescopes — both on the ground and in space including NASA’s James Webb and Hubble Space Telescopes — to combine this unique X-ray data with information from other types of light.
The richness of the Chandra Source Catalog is illustrated in a new image of the Galactic Center, the region around the supermassive black hole at the center of the Milky Way galaxy called Sagittarius A*. In this image that spans just about 60 light-years across, a veritable pinprick on the entire sky, Chandra has detected over 3,300 individual sources that emit X-rays. This image is the sum of 86 observations added together, representing over three million seconds of Chandra observing time.
Another new representation of the vast scope of the Chanda Source Catalog is found in a just-released sonification, the translation of astronomical data into sound. This sonification encompasses the new map that includes 22 years of Chandra observations across the sky, beginning from its launch through its observations in 2021. Because many X-ray sources have been observed multiple times over the life of the Chandra mission, this sonification represents those repeat X-ray sightings over time through different notes.
In the view of the sky, projected in a similar way to how the Earth is often depicted in world maps, the core of the Milky Way is in the center and the Galactic plane is horizontal across the middle of the image. A circle appears at the position of each detection and the size of the circle is determined by the number of detections in that location over time. A year counter appears at the top of the frame. Since Chandra continues to be fully operational, the text changes to “… and beyond” after 2021 as the telescope continues to collect observations. During the video, a collage of images produced by Chandra fades in as a background. In the final frames of the video, thumbnail images representing the thousands of Chandra observations taken over the lifetime of the mission appear behind the sky map.
The most recent version of the Chandra Source Catalog can be accessed at https://cxc.cfa.harvard.edu/csc/
NASA’s Marshall Space Flight Center in Huntsville, Alabama, manages the Chandra program. The Smithsonian Astrophysical Observatory’s Chandra X-ray Center controls science operations from Cambridge, Massachusetts, and flight operations from Burlington, Massachusetts.
To learn more about Chandra, visit:
https://science.nasa.gov/chandra
Read more from NASA’s Chandra X-ray Observatory
Learn more about the Chandra X-ray Observatory and its mission here:
Visual Description
A very deep Chandra X-ray Observatory image around the Sagittarius A* supermassive black hole, located in the center of the Milky Way galaxy, is shown. The image is dominated by burnt orange, deep gold and blue hues, with a sprinkling of rich green. The area looks both intricate and full, with a dense population of tiny dots, along with larger clumps and diffuse areas and nebulous areas peeking through.
At the center of the image, there is a bright, lumpy area in pale gold showing the intense X-ray radiation emanating from the Sagittarius A* black hole. In the surrounding area, there are more smaller lumps layered throughout, feathering out to a large almost butterfly shape filling much of the screen. The image appears textured, like dozens of blue and orange glow worms are paused in their wriggling.
The image offers an unprecedented view of lobes of hot gas extending for a dozen light years on either side of the black hole. These lobes provide evidence for powerful eruptions occurring several times over the last ten thousand years. The image also contains several mysterious X-ray filaments, some of which may be huge magnetic structures interacting with streams of energetic electrons produced by rapidly spinning neutron stars. Such features are known as pulsar wind nebulas. Chandra has detected over 3,300 individual sources that emit X-rays in this field of view. This image is the sum of 86 observations added together, representing over three million seconds of Chandra observing time.
News Media Contact
Megan Watzke
Chandra X-ray Center
Cambridge, Mass.
617-496-7998
mwatzke@cfa.harvard.edu
Joel Wallace
Marshall Space Flight Center, Huntsville, Alabama
256-544-0034
joel.w.wallace@nasa.gov