
From flammable neighborhoods to moral hazards, fire insurance maps capture early US cities and the landscape of discrimination
- Fire insurance maps were created from the 1860s to the 1970s for every city in the US with a population over 1,000 people, comprising over 700,000 map sheets that are now publicly accessible through the Library of Congress.
- These maps provide more than just historical insights into urban landscapes; they also reveal how insurance companies understood and addressed risk distribution across cities, often perpetuating costly biases.
- Fire insurance maps were used to determine whether a property was too risky to underwrite, taking into account factors such as neighborhood demographics, building materials, and industrial activities.
- The maps highlight the social landscape of neighborhoods, including coded information about alleged moral hazards, such as brothels or other riskier activities, which could lead to higher insurance premiums or disinvestment from insurers.
- Fire insurance maps also reveal systemic discrimination in urban planning and insurance underwriting, particularly against marginalized communities like African American neighborhoods, which were often subject to eminent domain and disinvestment from fire insurers.
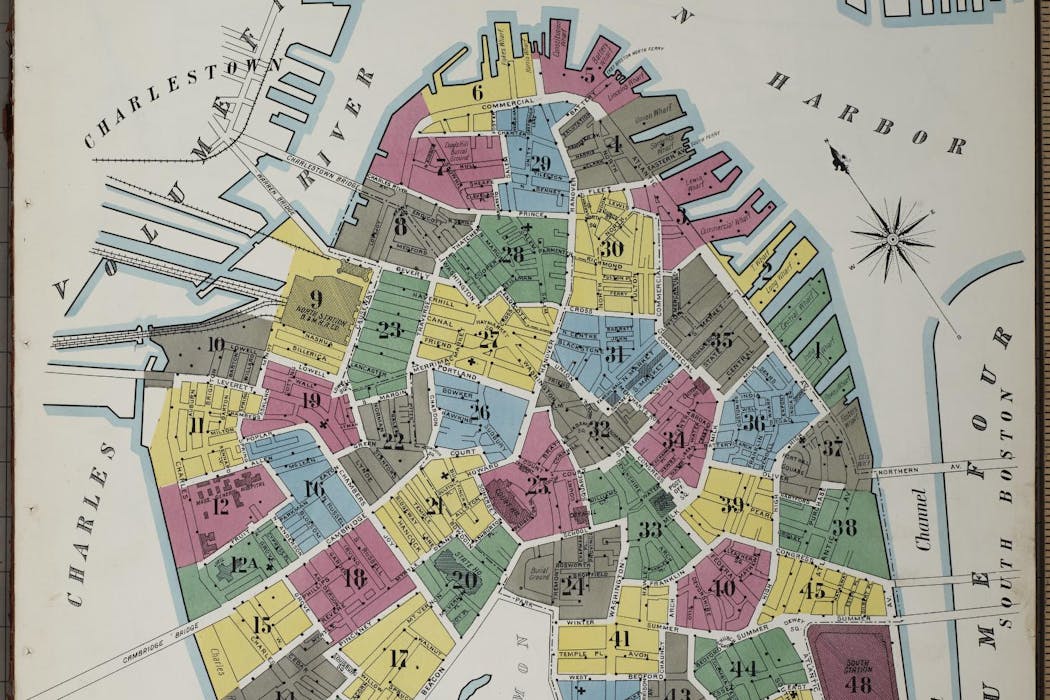
Imagine a map that allows you to see what your neighborhood looked like a century ago in immense detail. What you’re thinking of is probably very much like the fire insurance maps produced from the 1860s to the 1970s for insurance companies to identify potential fire risks.
Often referred to as Sanborn maps, after the Sanborn Map Co. that produced them, fire insurance maps were created for every city in the United States with a population greater than 1,000 people. Over a century, more than 50,000 editions of these maps were produced, comprising over 700,000 map sheets – many of which have been scanned and are publicly accessible through the Library of Congress.

Library of Congress
Genealogists, historic preservationists, historians and urban planners commonly use these maps to understand past urban landscapes. But as a critical cartographer interested in how maps shape how people understand the world, I see these maps differently.
Fire insurance maps supply more than just detailed insights into how neighborhoods looked decades ago. Needing to turn a profit, insurers sought to minimize the amount of risk they underwrote or charged higher premiums to account for risk. These maps provide important clues into how insurance companies understood how risk was distributed across cities, revealing costly biases.
Mapping fire risk
Before zoning and land-use planning, American cities frequently mixed industrial, commercial and residential buildings in the same block. Insurance agents used the immense detail of fire insurance maps to determine whether a property was too risky to underwrite, often weighing the demographics of the neighborhoods with the flammability of the buildings in the neighborhood.

Library of Congress
For example, an Atlanta neighborhood called Lightning was a Black, working-class district composed of a mixture of rail yards, noxious industries and residences in 1911. The neighborhood was also an immense fire hazard. Atlanta’s primary trash incinerator stood less than 150 feet from two massive natural gas storage tanks, while two gas processing plants manufactured specialized fuels just feet from homes.
Underwriters would use information from fire insurance maps to understand the local landscape. In these maps, colors correspond to the building’s construction material: pink indicates brick, while yellow indicates wood. Lightning was primarily made from wood, placing the entire neighborhood at risk if a fire broke out.
Fire insurance maps and discrimination
At the same time, fire insurance maps also highlight the social landscape of the neighborhood.
Many buildings in the Lightning fire insurance map are labeled “F.B.,” which stands for “female boarding,” a euphemism for brothels. While brothels were not a fire risk themselves, this code indicated the alleged moral hazard of a neighborhood, or the likelihood that property owners would allow riskier activities to occur on their property that could cost insurers more.

Library of Congress
From this one map, an underwriter could quickly see that Lightning was an extremely risky place to insure. Along with disinvestment from fire insurers, marginalized communities like Lightning also experienced other forms of systemic discrimination. Scholars have documented racial discrimination in car, life and health insurance underwriting.
Indeed, in the 1970s, much of Lightning was purchased under the threat of eminent domain – the legal process through which the government takes ownership of private land for public use – to construct the Georgia Dome, now the site of Mercedes-Benz Stadium.
Although fire insurance maps are no longer used in the insurance industry, they provide researchers one way of seeing how discrimination in fire insurance and urban planning manifested in the United States during the 20th century.
![]()
Jack Swab does not work for, consult, own shares in or receive funding from any company or organization that would benefit from this article, and has disclosed no relevant affiliations beyond their academic appointment.